Research
Most of my work is in the Permian Basin of West Texas and New Mexico, where I use satellite radar and geomechanical models to track how oil and gas production and wastewater injection move the ground, and what that means for faults, wells and infrastructure. I also study groundwater-driven subsidence in cities, mining and slope hazards, and methods for new radar missions.
Approach
A radar satellite images the same ground every week or two. If the surface has moved between two passes, the signal’s round trip changes by a fraction of a wavelength. Comparing the phase of the two images turns that fraction into a map of motion, called an interferogram. Stacking hundreds of them over years separates steady deformation from noise.
To explain the motion I build poroelastic models, which link changes in fluid pressure underground to stress in the rock and to movement at the surface. When a model reproduces what the satellite saw, it constrains the pressures, hydraulic properties and faults that cannot be observed directly.
Fluid-driven deformation in the Permian Basin
West Texas and southeastern New Mexico
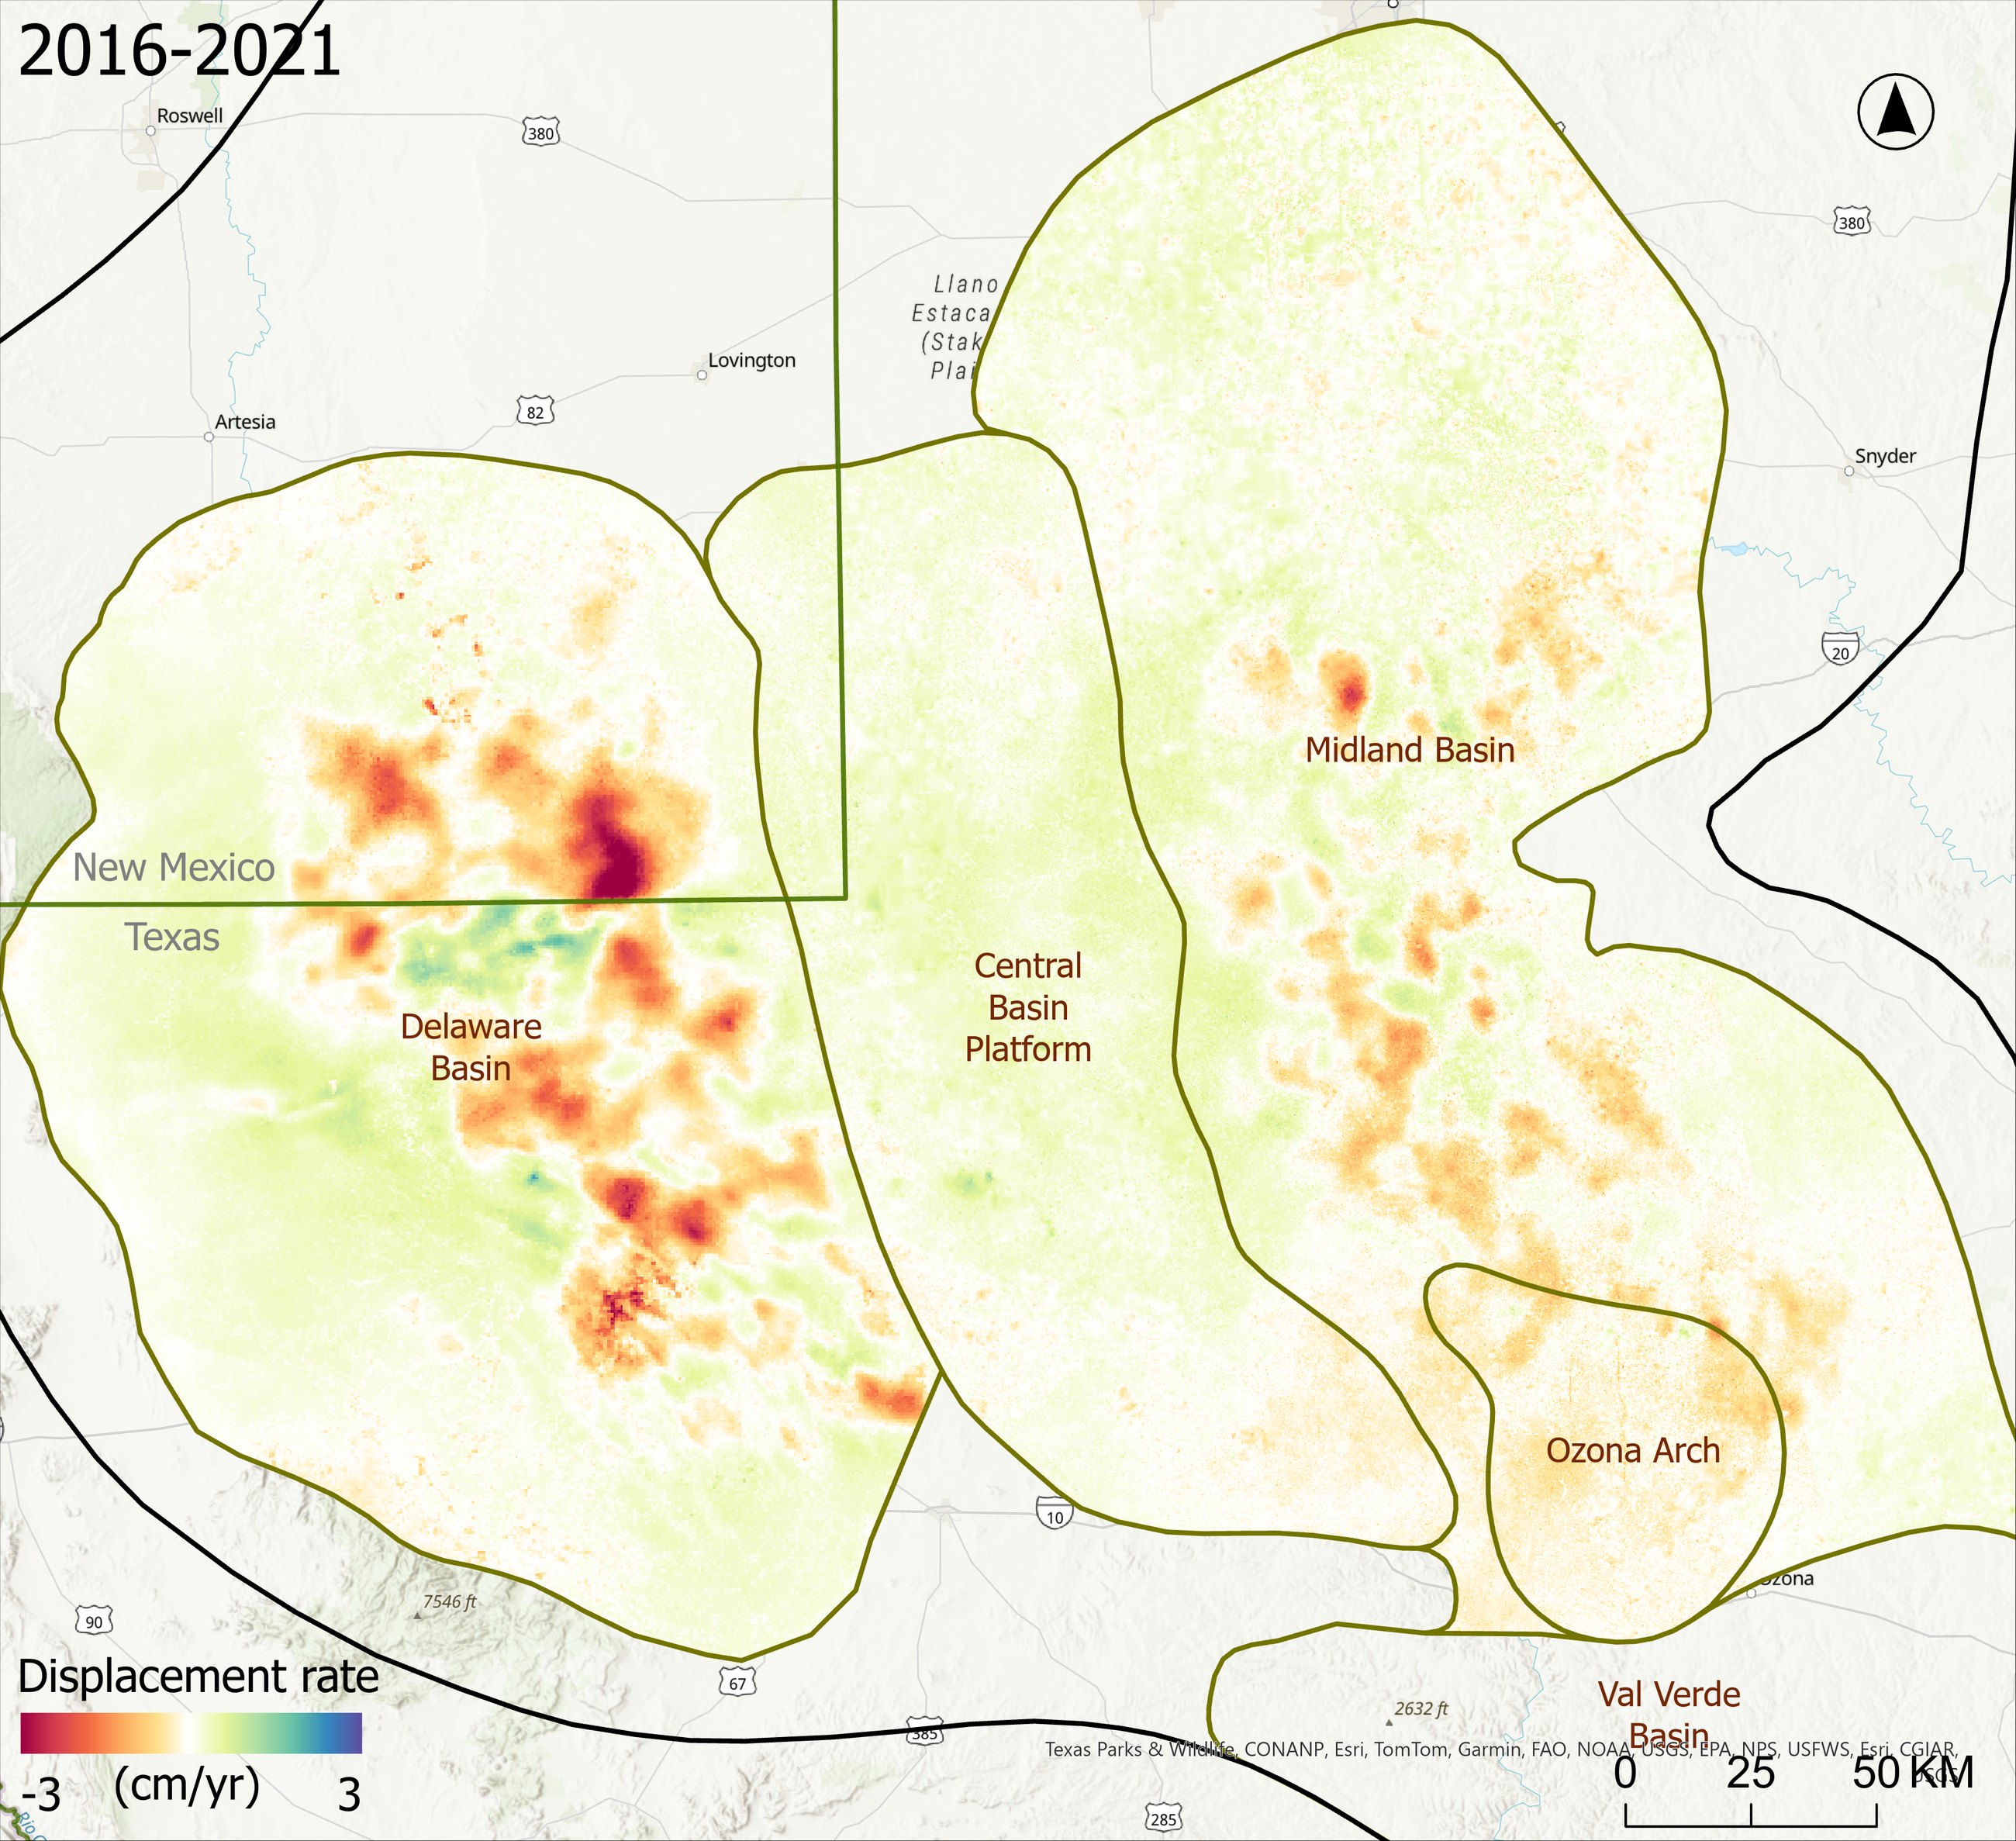
The Permian Basin is one of the most productive oil and gas regions in the United States. Production, wastewater disposal and a dense network of old wells have changed the pressure underground, and the ground surface records it. Using Sentinel-1 radar from 2016 onward, I map where the basin is sinking or rising and link that motion to production, injection, faults and failing wells.
Key findings
- Ground motion is widespread across the basin. The Delaware Basin sinks over large areas, while the Midland Basin and the Central Basin Platform show smaller, local features.
- In the northern Delaware Basin, subsidence is driven mainly by oil and gas production, which analytical source models tied to production records reproduce.
Papers
Faults and earthquakes in the southern Delaware Basin
Reeves, Pecos and Ward counties, Texas
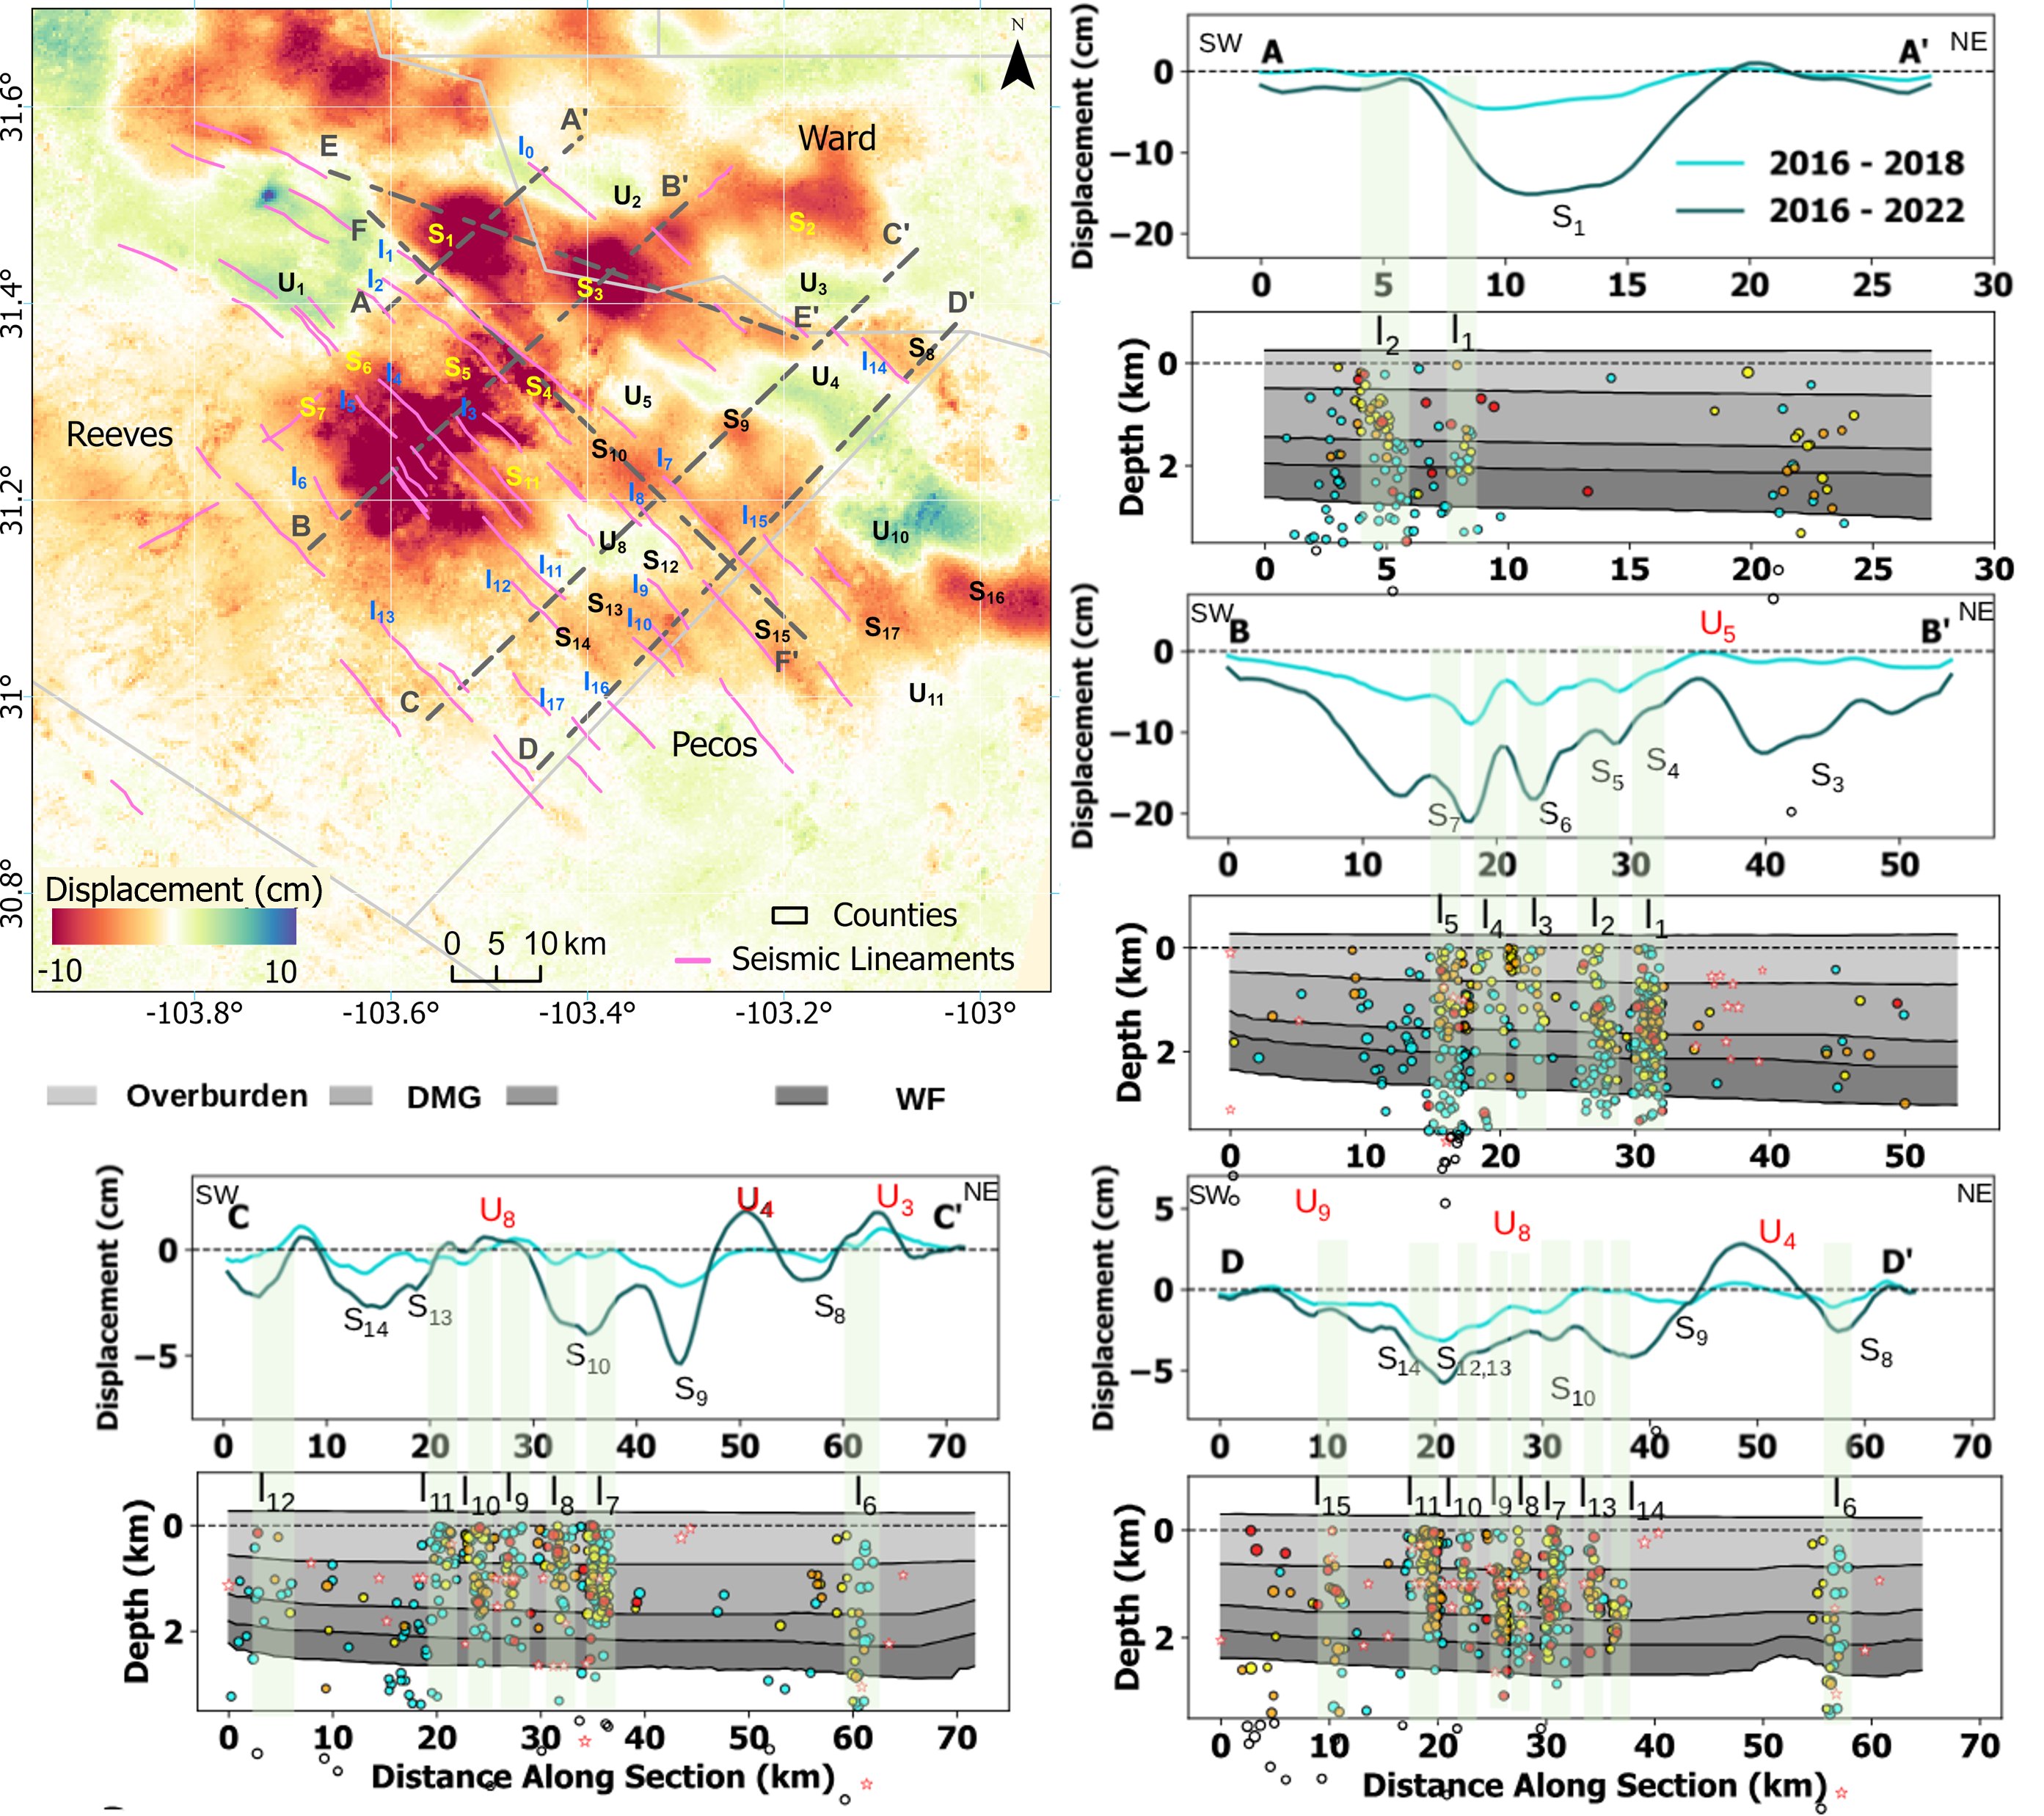
In the southern Delaware Basin the ground does not sink in smooth bowls. It breaks into narrow bands of subsidence and uplift that line up with seismic lineaments mapped from relocated TexNet earthquakes.
Cross-sections show the sharpest changes in surface motion sitting above clusters of shallow earthquakes. Together they point to seismic and aseismic slip on shallow normal faults, with faults steering where fluid pressure spreads.
Papers
Uplift before a well blowout at Tubbs Corner
Crane County, Texas
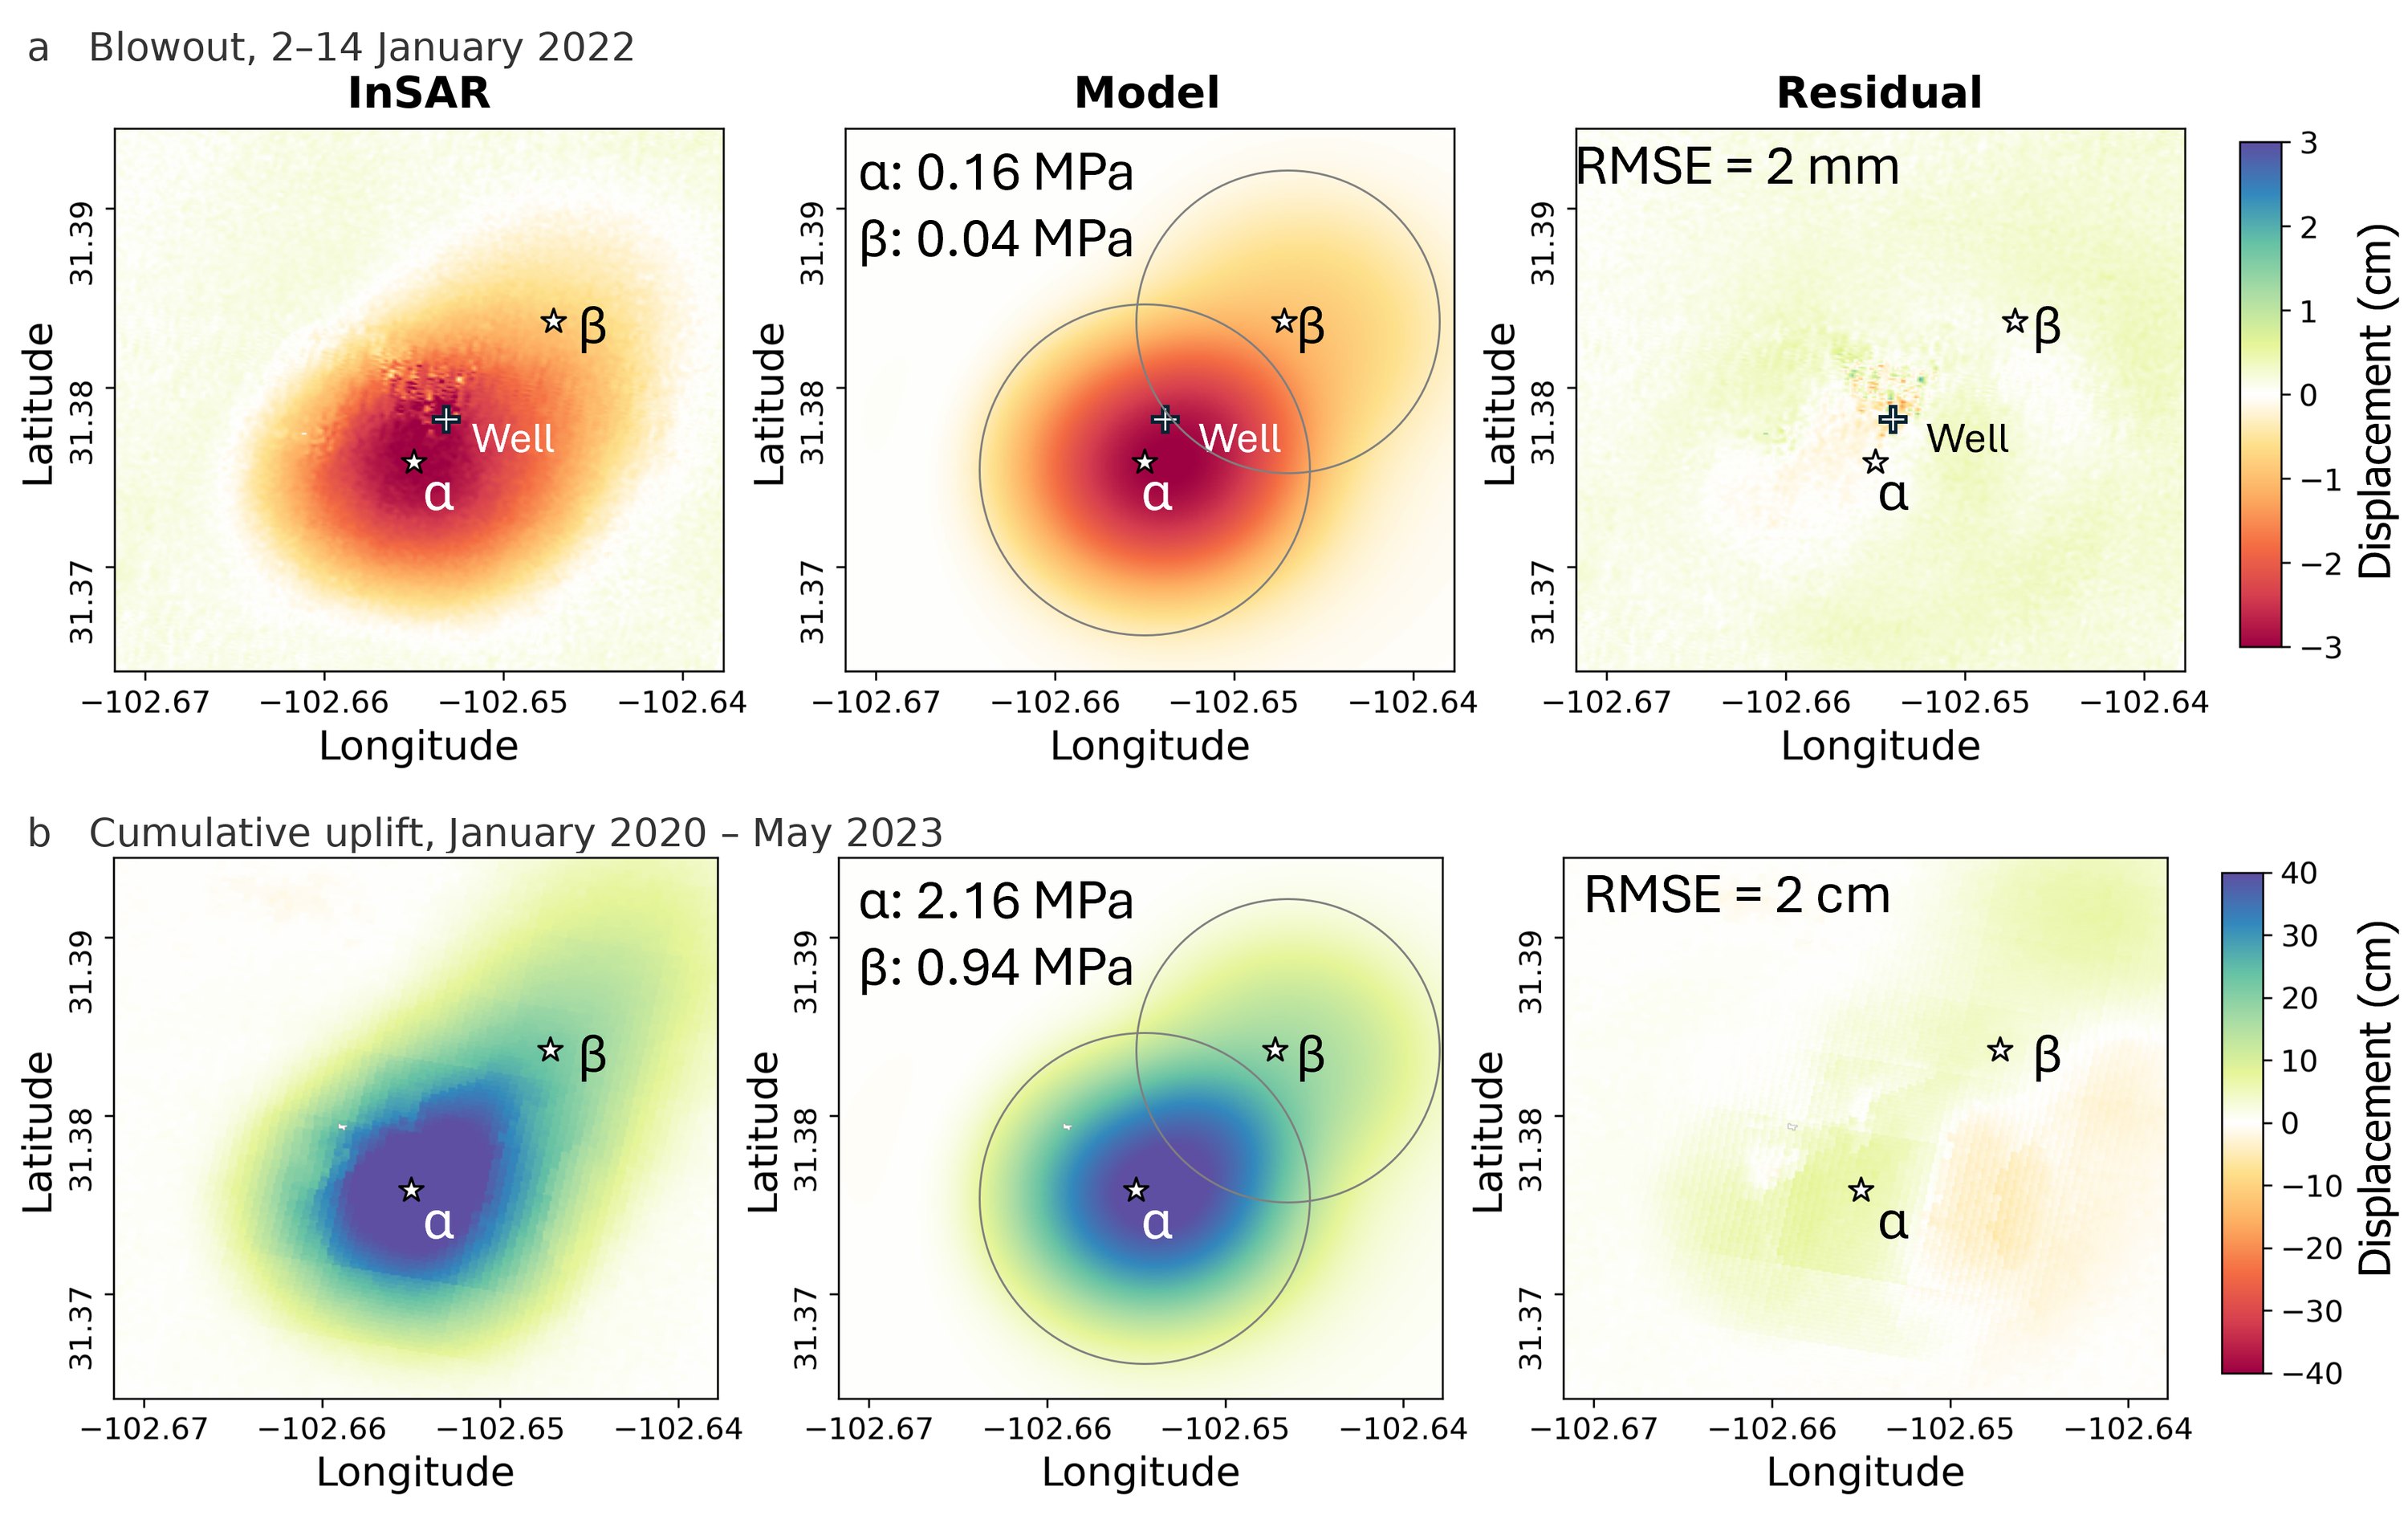
Before an old well at Tubbs Corner blew out in January 2022, the ground around it had risen by more than 40 cm. The uplift grew with wastewater disposal at injection wells to the northwest and spread toward the blowout site.
Modeling the motion as two pressurised sills (penny-shaped cracks) places the source at about 425 m depth, far shallower than the disposal zone more than a kilometre down. Wastewater appears to have migrated upward into shallower layers. The same model reproduces the 3 cm drop of the ground as pressure escaped during the blowout.
Uplift like this is visible from space before a well fails, which makes InSAR a practical way to watch for pressure building up around old wells.
Papers
In the news: Bloomberg, Newsweek, Reuters, The Texas Tribune and others. All 12 stories
Try it: drill a well
Pumping fluid out of the ground lowers the pressure in the rock and the surface sinks; injecting raises it and the surface rises. Click or tap the map to drill wells.
Methods
- InSAR time series
- Persistent scatterer and small-baseline analysis of Sentinel-1 and other SAR data.
- GNSS and in-situ data
- Ground truth for satellite measurements: GNSS, well logs, injection and production records.
- Offset tracking and 3D deformation
- Recovering the full motion vector, including where interferometry loses coherence.
- Poroelastic modeling
- 3D finite-element models that link fluid pressure to stress and surface motion.
- Geospatial data fusion
- Thermal, optical and radar imagery combined with GIS and machine learning for hazard mapping.
Software
- Radar processing
- GAMMA, ISCE, SNAP, StaMPS, MintPy, SARscape, ERDAS Imagine
- GIS and modeling
- ArcGIS Pro, QGIS, COMSOL Multiphysics, GBIS, AutoCAD
- Programming
- Python, MATLAB, Bash, Google Earth Engine
Urban subsidence and groundwater
Delhi National Capital Region, India
When a city pumps groundwater faster than it is replenished, the aquifer compacts and the land above it sinks. With colleagues at GFZ Potsdam and in India, I mapped subsidence across Delhi and its neighbours using InSAR and in-situ data, identifying the hotspots that matter for urban safety and water management.
Key findings
- Parts of the National Capital Region are sinking, and the pattern follows groundwater extraction.
- Faridabad, south of Delhi, shows the same risk of ground movement in both remote sensing and in-situ data.
Papers
Mining, slopes and rock glaciers
Jharia, Joshimath and Southeastern Alaska
Some ground moves because of what lies beneath it or what flows across it. In the Jharia Coalfields I combined Landsat-8 thermal anomaly mapping with InSAR to measure the subsidence caused by underground coal fires. Related work tracks the sinking Himalayan town of Joshimath and the motion of rock glaciers in Southeastern Alaska.
Key findings
- Underground coal fires are causing land subsidence in the Jharia Coalfields that can be measured from space.
- Rock glacier motion in Southeastern Alaska varies in space and time with hydrometeorology and topography.
Papers
Methods for new SAR missions
NISAR distributes its imagery as geocoded products, which changes how ground motion has to be measured. I helped develop offset tracking on geocoded single-look complex images and 3D deformation workflows for NISAR, and I am building an integrated workflow that takes InSAR observations through to a calibrated 3D poroelastic model.
Study areas
-
Permian Basin 31.9°N, 102.9°W
Subsidence and uplift from oil and gas production and wastewater injection; well blowouts; induced earthquakes.
-
Southeastern Alaska 58.6°N, 135.0°W
Rock glacier kinematics measured with satellite interferometry.
-
Delhi NCR 28.6°N, 77.2°E
Land subsidence driven by groundwater extraction.
-
Joshimath 30.6°N, 79.6°E
Subsidence of a Himalayan town, from InSAR and ground surveys.
-
Jharia Coalfields 23.7°N, 86.4°E
Subsidence from underground coal fires and mining.